“Per Capita Income of Indian States” refers to the typical annual income of a region’s inhabitants. One year’s national income divided by population yields it. The per capita income of Indian states is often measured to compare regional disparities and economic strengths. PCI, short for per capita income, plays a central role in these comparisons.
Economists and policymakers use per capita income to evaluate a nation’s economy and living standards. Global per capita incomes compare countries’ prosperity. Economic productivity and living standards increase with per capita income. For example, the Indian per capita income 2024 data shows signs of economic recovery and growth.
Average per capita income growth indicates economic growth. However, per capita income does not show income distribution. Median income and the Gini coefficient give context for income inequality and living standards. Per capita income is still a popular economic indicator.
History of Per Capita Income of Indian States
India’s Glorious Past
Our story begins with a prosperous India, a dominant player in global trade. Imagine bustling ports and thriving industries contributing to a flourishing economy, where the per capita income in rupees would have rivaled global standards had it been measured then.
The Colonial Downturn
The arrival of the British, particularly after the decisive Battle of Plassey, marked a profound turning point in India’s economic trajectory. From being a global trading powerhouse, India was relegated to the mere supplier of raw materials for British manufacturing. The Industrial Revolution intensified this shift, as mass-produced British goods flooded the Indian markets, systematically undermining and crippling thriving domestic industries.
Economic Exploitation
This wasn’t just trade; it was economic imperialism. The British levied heavy taxes on Indian exports, making them less competitive. Meanwhile, cheaper British goods flooded the market, hindering Indian production and leading to a significant wealth drain, as Dadabhai Naoroji, the “Grand Old Man of India,” theorized. This contributed to a stark decline in what is the per capital income of Indian states?
Early Calculations and Challenges
Naoroji wasn’t alone in recognizing the economic plight. He and other prominent economists, such as VKRV Rao, R.C. Dutt, and William Digby, attempted to quantify the damage. They estimated the per capital income of Indian states in the pre-independence era (around 1867-68) to be a meager Rs. 20, clearly reflecting the lowest per capita figures.
Per Capita Income = Total National Income/Total Population = $100 billion/50 million = $2,000
Components of National Income

Here are the primary components:
- GDP: The market value of all final goods and services produced in a country in a given period. Includes consumption, government purchases, investments, and net exports.
- Net National Product (NNP): This is the GDP after subtracting depreciation. Depreciation describes the deterioration of a country’s capital over time.
- National Income (NI): The total money earned within a country. Payouts include wages, interest, rent, and profits. Take the NNP, subtract indirect taxes, and add subsidies.
- Personal Income (PI): A country’s residents’ total income before taxes. It is the total income of all individuals or households in a given period.
- Gross National Product (GNP): GDP plus net income from abroad – income from investments abroad minus domestic income by overseas residents.
India Per Capita Income 2024
| Rank | State/UT | Per Capita Income (₹ in thousand) |
|---|---|---|
| 1 | Sikkim | 587.74 |
| 2 | Goa* | 492.65 |
| 3 | Delhi | 461.91 |
| 4 | Chandigarh* | 399.65 |
| 5 | Telangana | 356.56 |
| 6 | Karnataka | 332.93 |
| 7 | Haryana | 325.76 |
| 8 | Tamil Nadu | 315.22 |
| 9 | Kerala | 281.00 |
| 10 | Maharashtra | 277.60 |
| 11 | Gujarat* | 272.45 |
| 12 | Puducherry | 262.17 |
| 13 | Uttarakhand | 260.20 |
| 14 | Andaman & Nicobar Islands* | 258.15 |
| 15 | Andhra Pradesh | 242.48 |
| 16 | Himachal Pradesh | 235.20 |
| 17 | Mizoram* | 215.14 |
| 18 | Arunachal Pradesh* | 199.99 |
| 19 | Punjab | 196.51 |
| 20 | Tripura | 177.72 |
| 21 | Rajasthan | 167.96 |
| 22 | Odisha | 163.10 |
| 23 | West Bengal | 154.12 |
| 24 | Chhattisgarh | 147.36 |
| 25 | Nagaland* | 145.54 |
| 26 | Madhya Pradesh | 142.57 |
| 27 | Jammu & Kashmir | 142.14 |
| 28 | Meghalaya | 136.95 |
| 29 | Assam | 135.79 |
| 30 | Manipur* | 111.85 |
| 31 | Jharkhand | 105.27 |
| 32 | Uttar Pradesh | 93.51 |
| 33 | Bihar | 60.34 |
Which State in India Has the Highest Per Capita Income in 2024?
Sikkim is the state with India’s highest per capita income in 2024. Here are some other top-ranking states by per capita income or the wealthiest states in India 2024 list:
- Sikkim: ₹587,745
- Goa: ₹492,650
- Delhi: ₹461,910
These states have achieved higher economic growth due to strong tourism, industrial development, and better infrastructure, contributing to a higher standard of living.
Per Capita Income Data Analysis
Per Capita Income of Indian States: Previous Years’ Data
| Year | Nominal GDP per capita ($) at Current Price | Nominal GDP per capita (₹) at Current Price | Nominal GDP per capita ($) at Constant Price | Nominal GDP per capita (₹) at Constant Price |
| 2020 | 1,901 | 1,39,423 | 1,966 | 1,44,239 |
| 2019 | 2,101 | 1,54,273 | 2,152 | 1,57,912 |
| 2018 | 1,997 | 1,46,601 | 2,090 | 1,53,410 |
| 2017 | 1,981 | 1,45,313 | 1,982 | 1,45,313 |
| 2016 | 1,733 | 1,27,121 | 1,876 | 1,37,572 |
| 2015 | 1,606 | 1,17,640 | 1,752 | 1,28,512 |
| 2014 | 1,574 | 1,15,422 | 1,640 | 1,20,240 |
| 2013 | 1,450 | 1,06,350 | 1,545 | 1,13,295 |
| 2012 | 1,444 | 1,05,820 | 1,469 | 1,07,657 |
| 2011 | 1,458 | 1,06,742 | 1,410 | 1,03,330 |
| 2010 | 1,358 | 99,446 | 1,358 | 99,446 |
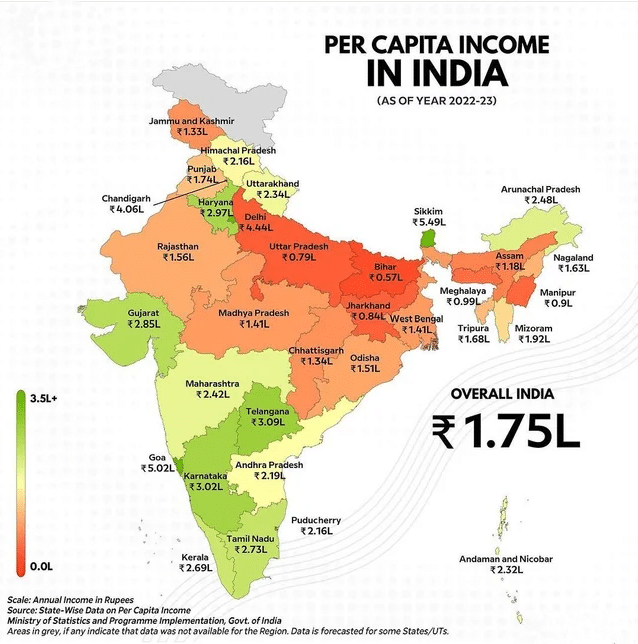
Per Capita Income of Indian States Based on Current Prices 2022-23
| PER CAPITA INCOME BASED ON CURRENT PRICES (In Rs) As on 01.08.2023 | |||
| S. No. | State\UT | 2022-23 | 2023-24 |
| 1 | Andhra Pradesh | 2,19,518 | 2,42,479 |
| 2 | Arunachal Pradesh | 2,05,645 | – |
| 3 | Assam | 1,18,504 | 1,35,787 |
| 4 | Bihar | 54,111 | 60,337 |
| 5 | Chhattisgarh | 1,33,898 | 1,47,361 |
| 6 | Goa | 4,72,070 | 4,92,648 |
| 7 | Gujarat | 2,41,930 | – |
| 8 | Haryana | 2,96,685 | 3,25,759 |
| 9 | Himachal Pradesh | 2,22,227 | 2,35,199 |
| 10 | Jharkhand | 91,874 | 1,05,274 |
| 11 | Karnataka | 3,01,673 | 3,32,926 |
| 12 | Kerala | 2,33,855 | 2,81,001 |
| 13 | Madhya Pradesh | 1,21,594 | 1,42,565 |
| 14 | Maharashtra | 2,15,233 | 2,77,603 |
| 15 | Manipur | 91,560 | – |
| 16 | Meghalaya | 1,12,737 | 1,36,948 |
| 17 | Mizoram | 1,98,962 | – |
| 18 | Nagaland | 1,25,887 | – |
| 19 | Odisha | 1,49,902 | 1,63,101 |
| 20 | Punjab | 1,81,716 | 1,96,505 |
| 21 | Rajasthan | 1,56,149 | 1,67,964 |
| 22 | Sikkim | 5,19,964 | 5,87,743 |
| 23 | Tamil Nadu | 2,75,583 | 3,15,220 |
| 24 | Telangana | 3,12,398 | 3,56,564 |
| 25 | Tripura | 1,59,419 | 1,77,723 |
| 26 | Uttar Pradesh | 83,565 | 93,514 |
| 27 | Uttarakhand | 2,33,565 | 2,60,201 |
| 28 | West Bengal | 2,33,565 | 1,54,119 |
| 29 | Andaman & Nicobar Islands | 2,29,080 | – |
| 30 | Chandigarh | 3,33,932 | – |
| 31 | Delhi | 4,44,768 | 4,61,910 |
| 32 | Jammu & Kashmir-UT | 1,36,771 | 1,42,138 |
| 33 | Puducherry | 2,51,344 | 2,62,166 |
Per Capita Income of Indian States: Slowest Growth
Bihar, Punjab, and Jharkhand have shown the lowest per capita income growth in a decade, reflecting these regions’ persistent challenges. These states, which have some of the lowest per capita indicators and PCI levels, indicate substantial economic underdevelopment. The leading causes are low industrialization, weak infrastructure, lack of skill development, health and education underinvestment, and limited job creation opportunities. With the Indian per capita income in 2024 rising, disparities like these have become even more apparent. The India GDP 2025 targets can only be met if attention is given to uplifting these low-performing states.
Slow growth in the per capita income of Indian states like Bihar contributes to socioeconomic stagnation. Skill India, private investments, job creation incentives, and targeted public spending are essential strategies to stimulate growth. Strategic strengthening of these economic growth drivers is necessary to bridge the gap between Indian states regarding GDP per capita. While some regions approach the highest per capita income state in India benchmarks, others still struggle at the lowest per capita end of the spectrum.
Per Capita Income of Indian States Wise List
Here is the list of the Highest Per Capita Income of Indian States Wise List, showcasing states with strong PCI growth and setting benchmarks for others:
| Rank | State/Union Territory | NSDP Per Capita (₹) | NSDP Per Capita ($) |
| 1 | Goa | ₹ 4,72,070 | $ 6,215 |
| 2 | Sikkim | ₹ 4,63,509 | $ 6,102 |
| 3 | Delhi | ₹ 3,89,529 | $ 5,128 |
| 4 | Chandigarh | ₹ 3,33,932 | $ 4,396 |
| 5 | Telangana | ₹ 2,70,839 | $ 3,566 |
| 6 | Karnataka | ₹ 2,65,623 | $ 3,497 |
| 7 | Haryana | ₹ 2,64,835 | $ 3,487 |
| 8 | Puducherry | ₹ 2,51,344 | $ 3,309 |
| 9 | Tamil Nadu | ₹ 2,42,253 | $ 3,189 |
| 10 | Gujarat | ₹ 2,41,930 | $ 3,185 |
| 11 | Kerala | ₹ 2,33,855 | $ 3,079 |
| 12 | Andaman and Nicobar Islands | ₹ 2,29,080 | $ 3,016 |
| 13 | Maharashtra | ₹ 2,15,233 | $ 2,834 |
| 14 | Uttarakhand | ₹ 2,11,657 | $ 2,786 |
| 15 | Arunachal Pradesh | ₹ 2,05,645 | $ 2,707 |
| 16 | Himachal Pradesh | ₹ 2,01,271 | $ 2,650 |
| 17 | Mizoram | ₹ 1,98,962 | $ 2,619 |
| 18 | Andhra Pradesh | ₹ 1,92,587 | $ 2,535 |
| 19 | Punjab | ₹ 1,68,705 | $ 2,221 |
| 20 | Tripura | ₹ 1,37,472 | $ 1,810 |
| 21 | Rajasthan | ₹ 1,35,962 | $ 1,790 |
| 22 | Odisha | ₹ 1,28,181 | $ 1,687 |
| 23 | Nagaland | ₹ 1,25,887 | $ 1,657 |
| 24 | West Bengal | ₹ 1,24,798 | $ 1,643 |
| 25 | Madhya Pradesh | ₹ 1,21,594 | $ 1,601 |
| 26 | Jammu and Kashmir | ₹ 1,20,790 | $ 1,590 |
| 27 | Chhattisgarh | ₹ 1,20,704 | $ 1,589 |
| 28 | Meghalaya | ₹ 1,03,335 | $ 1,360 |
| 29 | Assam | ₹ 1,02,965 | $ 1,356 |
| 30 | Manipur | ₹ 91,560 | $ 1,205 |
| 31 | Jharkhand | ₹ 84,059 | $ 1,107 |
| 32 | Uttar Pradesh | ₹ 73,048 | $ 962 |
| 33 | Bihar | ₹ 47,498 | $ 625 |
This list is crucial to understanding disparities in India’s per capita income. States like Goa and Sikkim consistently lead the charts with top PCI rankings. Delhi also stands out as the wealthiest state in India based on the latest Indian per capita income 2024 figures.
Economic Analysis of Per Capita Income of Indian States
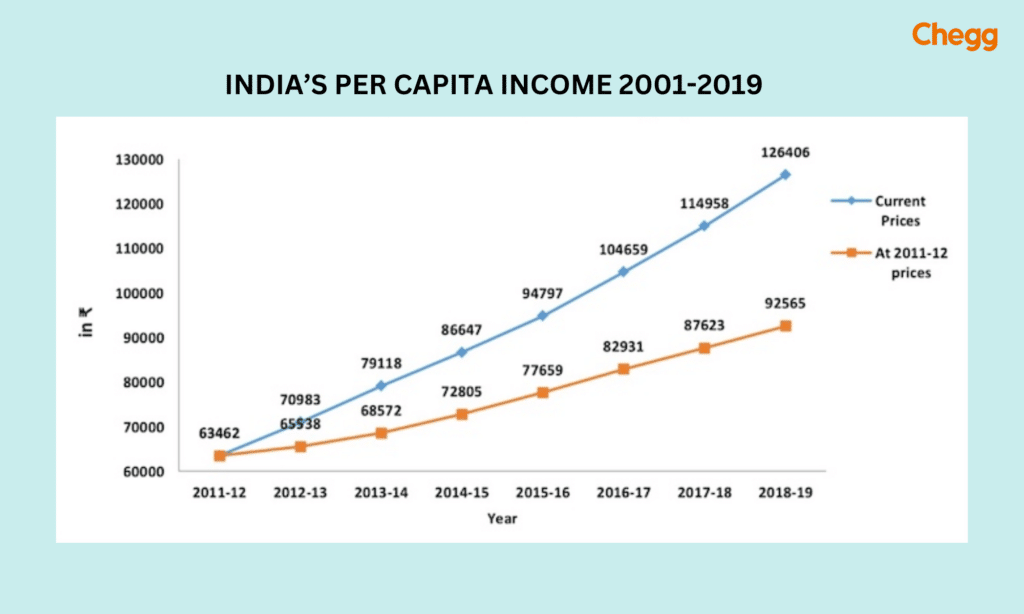
As per the latest provisional estimates published on 31 May 2023, India’s per capita Net National Income (NNI) at constant (2011–12) prices increased by 35.12% from Rs. 72,805 in 2014–15 to Rs. 98,374 in 2022–23. The per capita income in rupees reached around 170,000 in 2023, further reinforcing the strength of India’s GDP 2024 data. With India’s GDP 2025 projections aiming higher, PCI metrics become vital for planning.
The annual growth rate was 13.7% compared to the previous year. This spike reflects robust economic performance and masks the lowest per capita trends in some lagging states. The average inflation and consistent PCI improvement are signs of potential economic convergence if policies are aligned.
| CPI Base 2012=100 | Growth rate of Per Capita NNI (In %) | ||
| Year | Inflation based on CPI | At Current Prices | At Constant (2011-12) Prices |
| 2014-15 | 5.93 | 9.5 | 6.2 |
| 2015-16 | 4.91 | 9.4 | 6.7 |
| 2016-17 | 4.52 | 10.6 | 6.9 |
| 2017-18 | 3.59 | 9.9 | 5.5 |
| 2018-19 | 3.41 | 9.3 | 5.2 |
| 2019-20 | 4.77 | 5.1 | 2.5 |
| 2020-21 | 6.16 | -4.0(2nd RE) | -8.9(2nd RE) |
| 2021-22 | 5.51 | 16.9(1st RE) | 7.6(1st RE) |
| 2022-23 | 6.65 | 16.0(PE) | 6.3(PE) |
India’s GVA Breakdown: Sector Contributions (2018-19 to 2022-23)
Understanding the Per Capita Income of Indian States and how India’s economy is structured is key to understanding the per capita income of Indian states, which is tied directly to India’s economic structure. The GVA data reveals how sectors like services and manufacturing influence PCI and income disparities. With agriculture contributing 18.42% and services over 50%, targeting these sectors could reshape the PCI distribution across Indian states by GDP per capita.
| S.No. | Economic Activity/Sector | 2018-19 (%) | 2019-20 (%) | 2020-21 (%) | 2021-22 (%) | 2022-23 (%) |
| 1 | Agriculture, forestry and fishing | 17.64 | 18.33 | 20.32 | 18.97 | 18.42 |
| 2 | Mining and quarrying | 2.20 | 1.94 | 1.74 | 2.00 | 2.36 |
| 3 | Manufacturing | 16.38 | 14.72 | 15.40 | 15.84 | 14.70 |
| 4 | Electricity, Gas, Water supply & Other utility services | 2.62 | 2.74 | 2.75 | 2.59 | 3.00 |
| 5 | Construction | 7.87 | 7.50 | 7.39 | 8.10 | 8.19 |
| 6 | Trade, Hotels, Transport, Communication & Services related to Broadcasting | 18.65 | 18.93 | 15.78 | 16.85 | 17.98 |
| 7 | Financial, Real Estate & Professional Services | 20.55 | 21.11 | 22.19 | 21.51 | 21.42 |
| 8 | Public Administration, Defence& Other Services | 14.10 | 14.74 | 14.43 | 14.13 | 13.94 |
| 9 | TOTAL GVA at basic prices | 100.00 | 100.00 | 100.00 | 100.00 | 100.00 |
Key Takeaways:
- Services Dominate: The services sector remains the dominant contributor, aligning with higher PCI in urbanized regions.
- Manufacturing Stability: Consistent manufacturing shares highlight states with balanced PCI growth.
- Agriculture’s Role: Still vital in areas with the lowest per capita incomes.
- Public Services Impact: Approximately 10% contribution underscores the role of governance.
Second Advance Estimates of NIEC of GDP, 2022-23 (at 2011- 12 Prices)
This table reflects the evolution of per capita income of Indian states from 2020–21 to 2022–23.
| Item | 2020-21 (Second Revised Estimates) | 2021-22 (First Revised Estimates) | 2022-23 (Second Advanced Estimates) | % Change (2021-22 over 2020-21) | % Change (2022-23 over 2021-22) |
| Population (in million) | 1355 | 1369 | 1383 | – | – |
| Per Capita GDP (INR) | 100,981 | 109,060 | 115,490 | 8.0% | 5.9% |
| Per Capita GNI (INR) | 99,578 | 106,822 | 113,144 | 7.3% | 5.9% |
| Per Capita NNI (INR) | 86,054 | 92,583 | 98,118 | 7.6% | 6.0% |
| Per Capita PFCE (INR) | 57,728 | 63,595 | 67,555 | 10.2% | 6.2% |
Key Takeaways:
- Steady Rise: Per capita income of Indian States has shown consistent growth, reaching ₹1,15,490 in 2022-23.
- Growth Rates:
- 2021-22: 8.0% increase over 2020-21.
- 2022-23: 5.9% increase over 2021-22.
- Per Capita Breakdown:
- Gross Domestic Product (GDP): ₹1,15,490
- Gross National Income (GNI): ₹1,13,144
- Net National Income (NNI): ₹98,118
- Consumption on the Rise:
- Per capita final consumption expenditure (PFCE) also grew, reaching ₹67,555 in 2022-23.
Significance of Per Capita Income in India
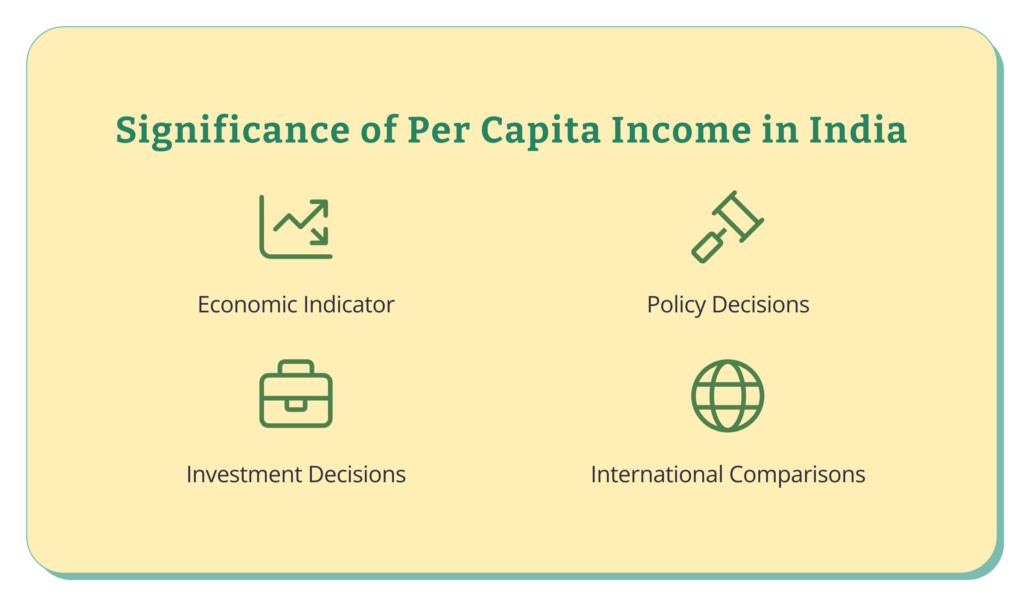
Per capita income, or income per person, measures the amount of money earned per person in a particular area in a specified period. It is often used as an indicator of living standards or economic well-being. Let’s delve into the significance of the Per Capita Income of Indian States.
Economic Indicator
The per capita income of Indian States is a crucial economic indicator that helps gauge a country’s financial health. A higher per capita income indicates a higher standard of living and a robust economy, while a lower per capita income may suggest the opposite.
Policy Decisions
Per capita income is a vital statistic that aids policymakers in making informed decisions. It helps identify income disparities, understand economic challenges, and formulate policies for poverty alleviation and economic development.
Investment Decisions
Investors often consider per capita income when making investment decisions, as it can provide insights into a country’s economic stability and growth potential. A higher per capita income might attract more investors, suggesting a wealthier population and potentially a more significant market for goods and services.
International Comparisons
Per capita income allows for comparisons between countries, offering a more level perspective than absolute economic measures like Gross Domestic Product (GDP). It helps in understanding where a country stands on the global financial stage.
Income Disparity in India
According to official data from 2011, India’s Gini coefficient was 0.45, indicating high income inequality. However, this figure is lower than that of other emerging economies such as Brazil and South Africa. Since the liberalization of the economy in the 1990s, the incomes of the top 10% and 1% have increased significantly, driven mainly by expert services and corporate profits. Unfortunately, India still has a staggering 200 million people living in poverty, according to the World Bank. Minority groups, in particular, earn very little due to a lack of access to education, healthcare, and employment opportunities.
Responsibilities of the Ministry of Statistics and Programme
The Statistical and Programme Implementation Ministry (MoSPI) analyzes and reports economic growth policy and planning data. The ministry collects data on prices, industrial and agricultural production, employment, income, and demographics through surveys, censuses, and field investigations. Expert groups use statistical methods to find trends, projections, and problems in large datasets. The ministry publishes economic indicators, market conditions, population, resource allocation handbooks, bulletins, and statistical reports.
Bihar has the lowest per capita income in India. MoSPI oversees data collection and analysis for PCI, GDP, and related metrics. Their work supports transparent planning and equitable development. Through this data, India can identify the richest states in India and regions lagging behind.
Per Capita Income of Indian States UPSC
Understanding the Per Capita Income of Indian States (PCI) is crucial for UPSC aspirants aiming to excel in the Economy section. Here’s a breakdown:
- What it Means: PCI measures the average income earned by an individual in India annually.
- Importance for Development:
- Gauges the overall economic well-being of India and individual states.
- Reflects the efficiency of the production and distribution of goods and services.
- Calculation:
- National Income (total monetary value of goods & services produced) divided by India’s total population.
- Calculated by the Central Statistical Organization (CSO).
Why UPSC Aspirants Should Care:
- PCI is a key indicator of economic growth and development, a frequently tested UPSC topic.
- Understanding its calculation and interpretation demonstrates a firm grasp of economic fundamentals.
- Analyzing variations in PCI across states highlights regional disparities, another critical UPSC theme.
Conclusion
In conclusion, per capita income is a valuable metric for gauging a state’s economic development and living standards in India. While some states like Goa and Sikkim boast impressive per capita income figures, significant disparities exist nationwide. Regions like Bihar and Jharkhand struggle with lower per capita income, highlighting the need for targeted policies to promote balanced economic growth across all Indian states. Addressing infrastructure development, skill development, and job creation will be crucial in narrowing the gap and improving living standards for all citizens.
Read More:-
- UNESCO Biosphere Reserve in India
- What is GST Council – Role and Functions
- Typеs of Passport in India: An Overview
- Highest GDP State in India 2024

Frequently Asked Questions (FAQs)
Which state in India has the highest per capita income?
The state with the highest per capita income in India is Sikkim, with a per capita income of ₹5,88,000 for the year 2023-24.
Which state in India has the lowest GDP per capita?
Bihar has India’s lowest GDP per capita, with a per capita income of ₹47,498 ($625) for 2023-24.
Which state has the highest economy in India?
Maharashtra has the highest economy in India, measured by Gross State Domestic Product (GSDP).
Which State in India Has the Lowest Per Capita Income?
Bihar has the lowest per capita income in India. Bihar, Uttar Pradesh, and Madhya Pradesh also rank among the poorest states regarding per capita income.
Which are the top 5 PCI states in India?
The top 5 states in India by Per Capita Income (PCI) are- Sikkim, Goa, Delhi, Haryana, and Maharashtra.
What is per capita income of india in rupees?
As of 2023–24, India’s per capita income is approximately ₹1,72,000 annually. This figure represents the average annual income earned per person and reflects the country’s overall economic growth and living standards.
What will be india per capita income 2025?
India’s per capita income in 2025 is projected to be ₹205,579 in nominal terms and ₹114,705 in real terms (2011–12 prices). This reflects steady economic growth and improved living standards. GDP per capita is also expected to rise to ₹235,108, indicating broader expansion across the economy.